Market Recap: How WealthRabbit Portfolios Performed Through Q1 and Into April 2026
After the worst quarter in years, US equities roared back in April. Here's what happened in the markets and how every WealthRabbit portfolio responded.
Q1 2026 was rough. Geopolitical pressure, oil volatility, and persistent rate anxiety pushed US equities into the red across the board. Then April happened.
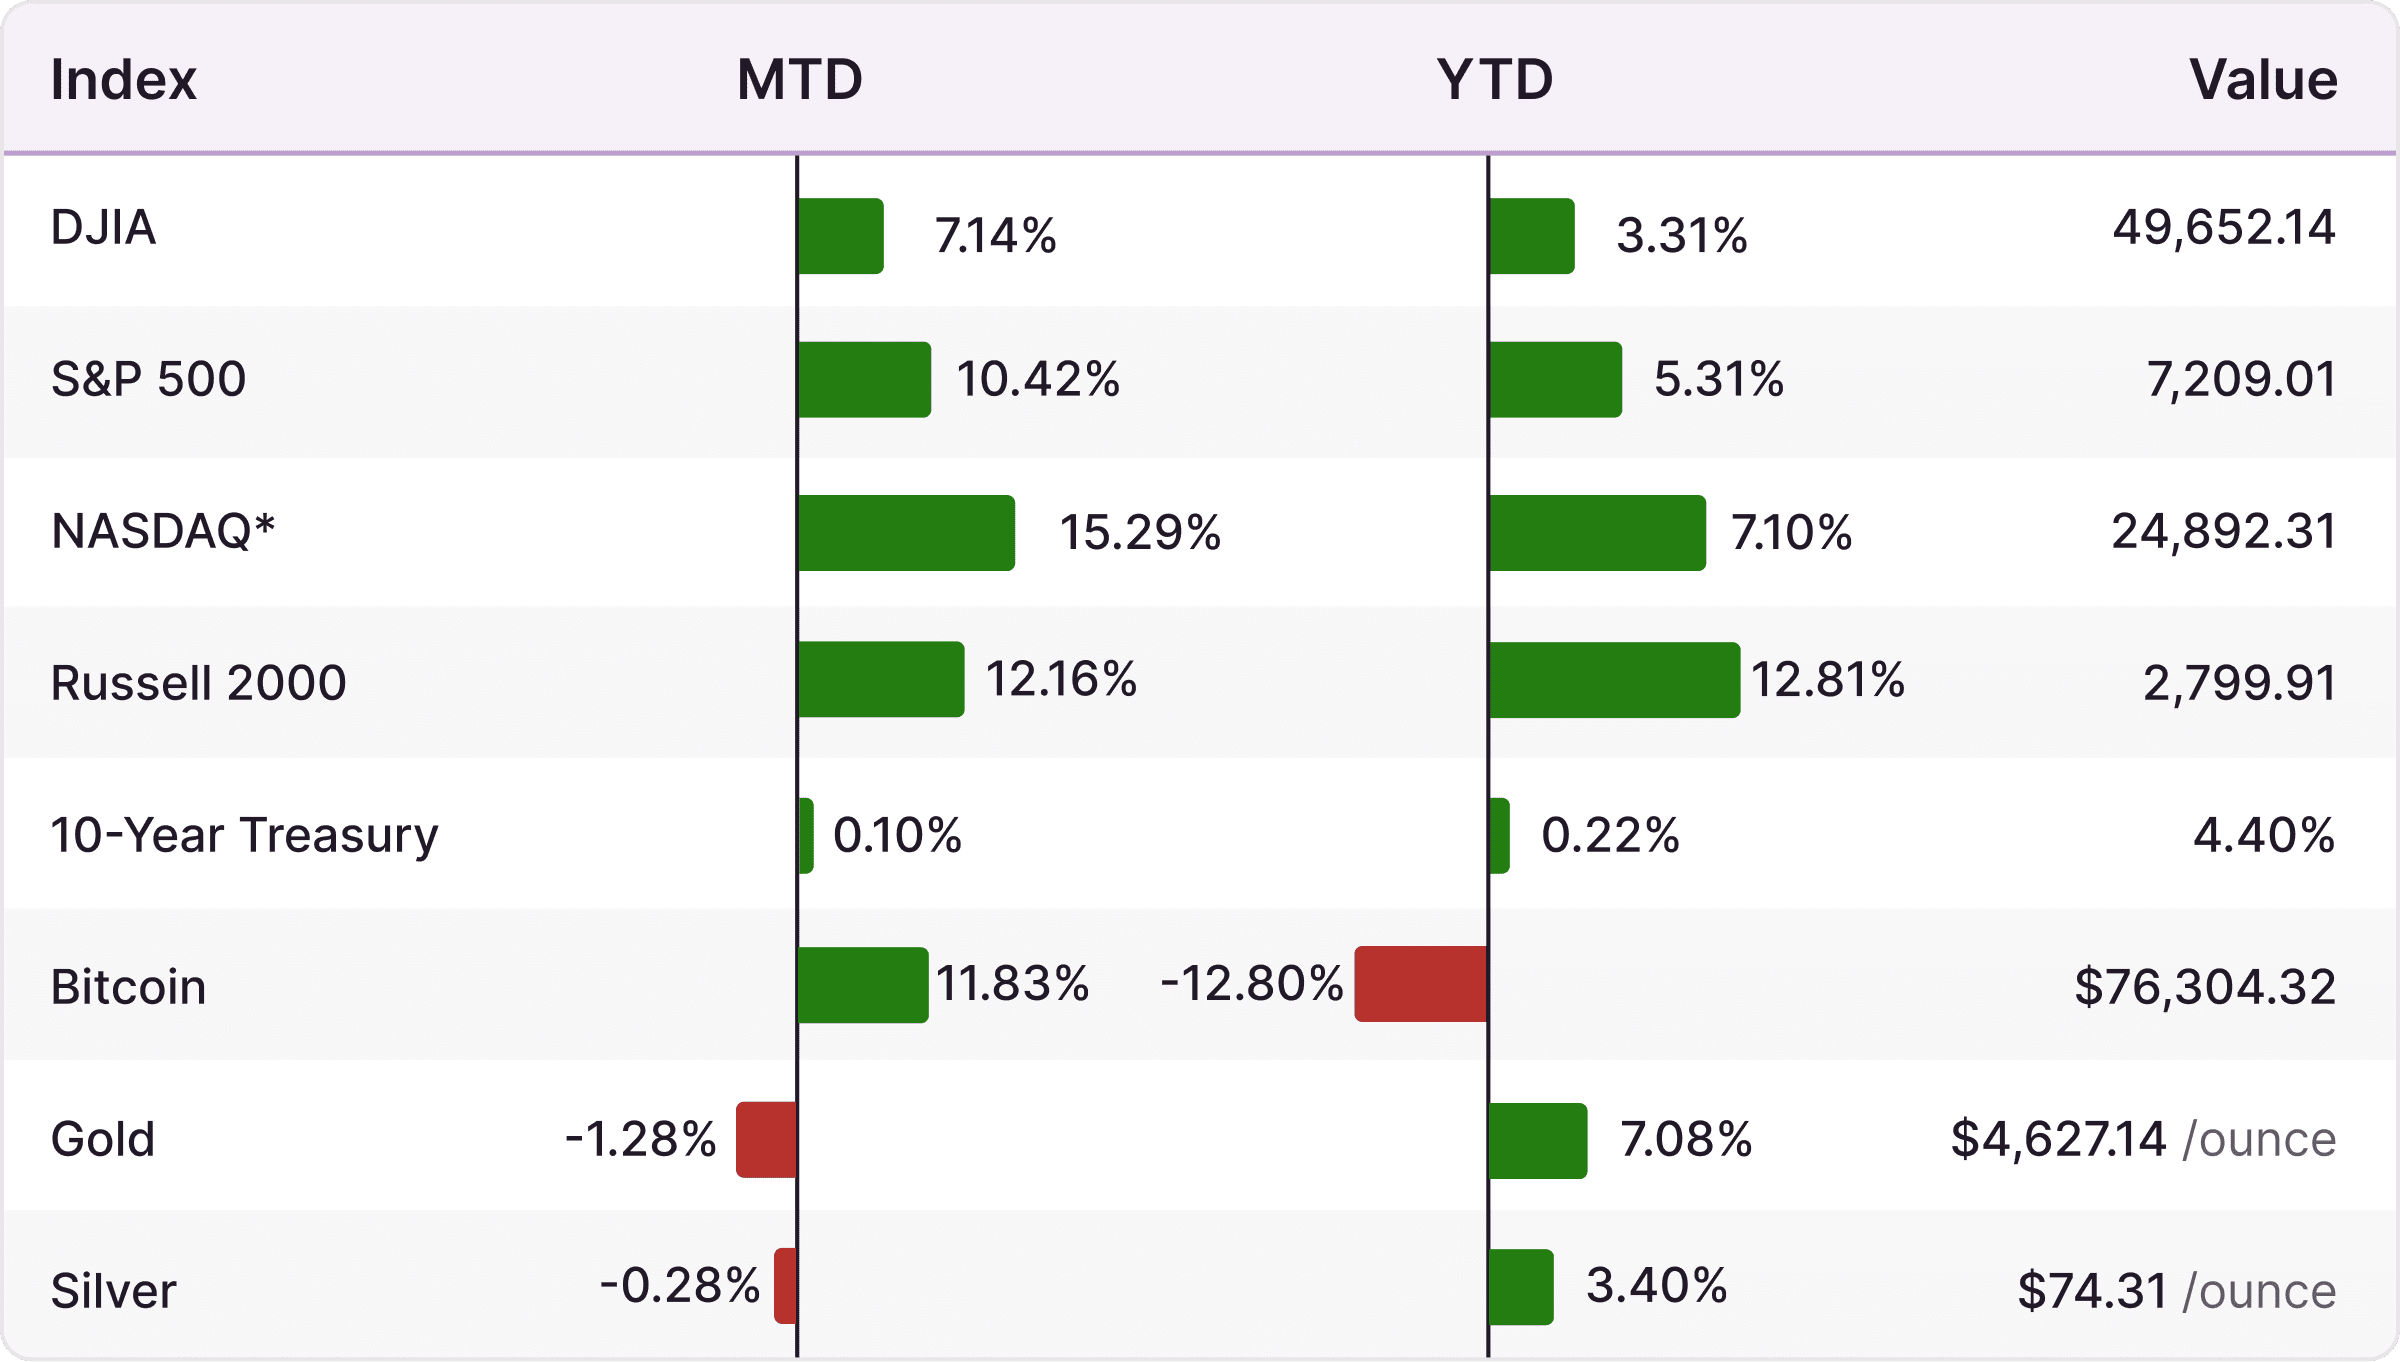
The S&P 500 surged 10.42% in a single month. One of its strongest monthly performances in over a year, recovering nearly all of its year-to-date losses and closing April up 5.31%. The Nasdaq did even better, rising 15.29% for the month.
*Annualized returns. Inception date: June 30, 2014. Performance shown is net of a 0.50% annual fee. Lower-tier fees of 0.20%–0.40% are available for qualifying accounts. Past performance does not guarantee future results.
The Russell 2000 was the standout performer, up 12.16% in April and 12.81% year-to-date, leading every major index since January. Small-cap companies were hit hardest in March, but they also had the most room to rebound. Their US-focused business models gave them an edge too, as large-cap multinationals continued to absorb the pressure from global supply chain disruptions.
The DJIA lagged slightly at 7.14%, weighed down by its industrial and energy exposure. Treasury yields kept climbing — the 10-year hit 4.40%, up from 3.97% in February — signaling that bond markets still aren't pricing in rate cuts anytime soon, even as equities recovered. Bitcoin rose 11.83% in April but remains down 12.80% for the year. Gold and silver pulled back slightly after their March run but both remain positive YTD.
The lesson Q1 keeps teaching
Investors who panicked and pulled out during March's selloff are now watching a recovery happen without them. The investors who kept contributing bought at lower prices and were rewarded with one of the strongest months for US equities in over a year. That's the pattern in every recovery from a geopolitical shock, going back decades. It almost never feels right to keep contributing during the drop. The recovery rarely waits for it to feel right.
Q1 closed red. April closed green. Whoever stayed the course came out ahead.
Every WealthRabbit portfolio beat the S&P this quarter
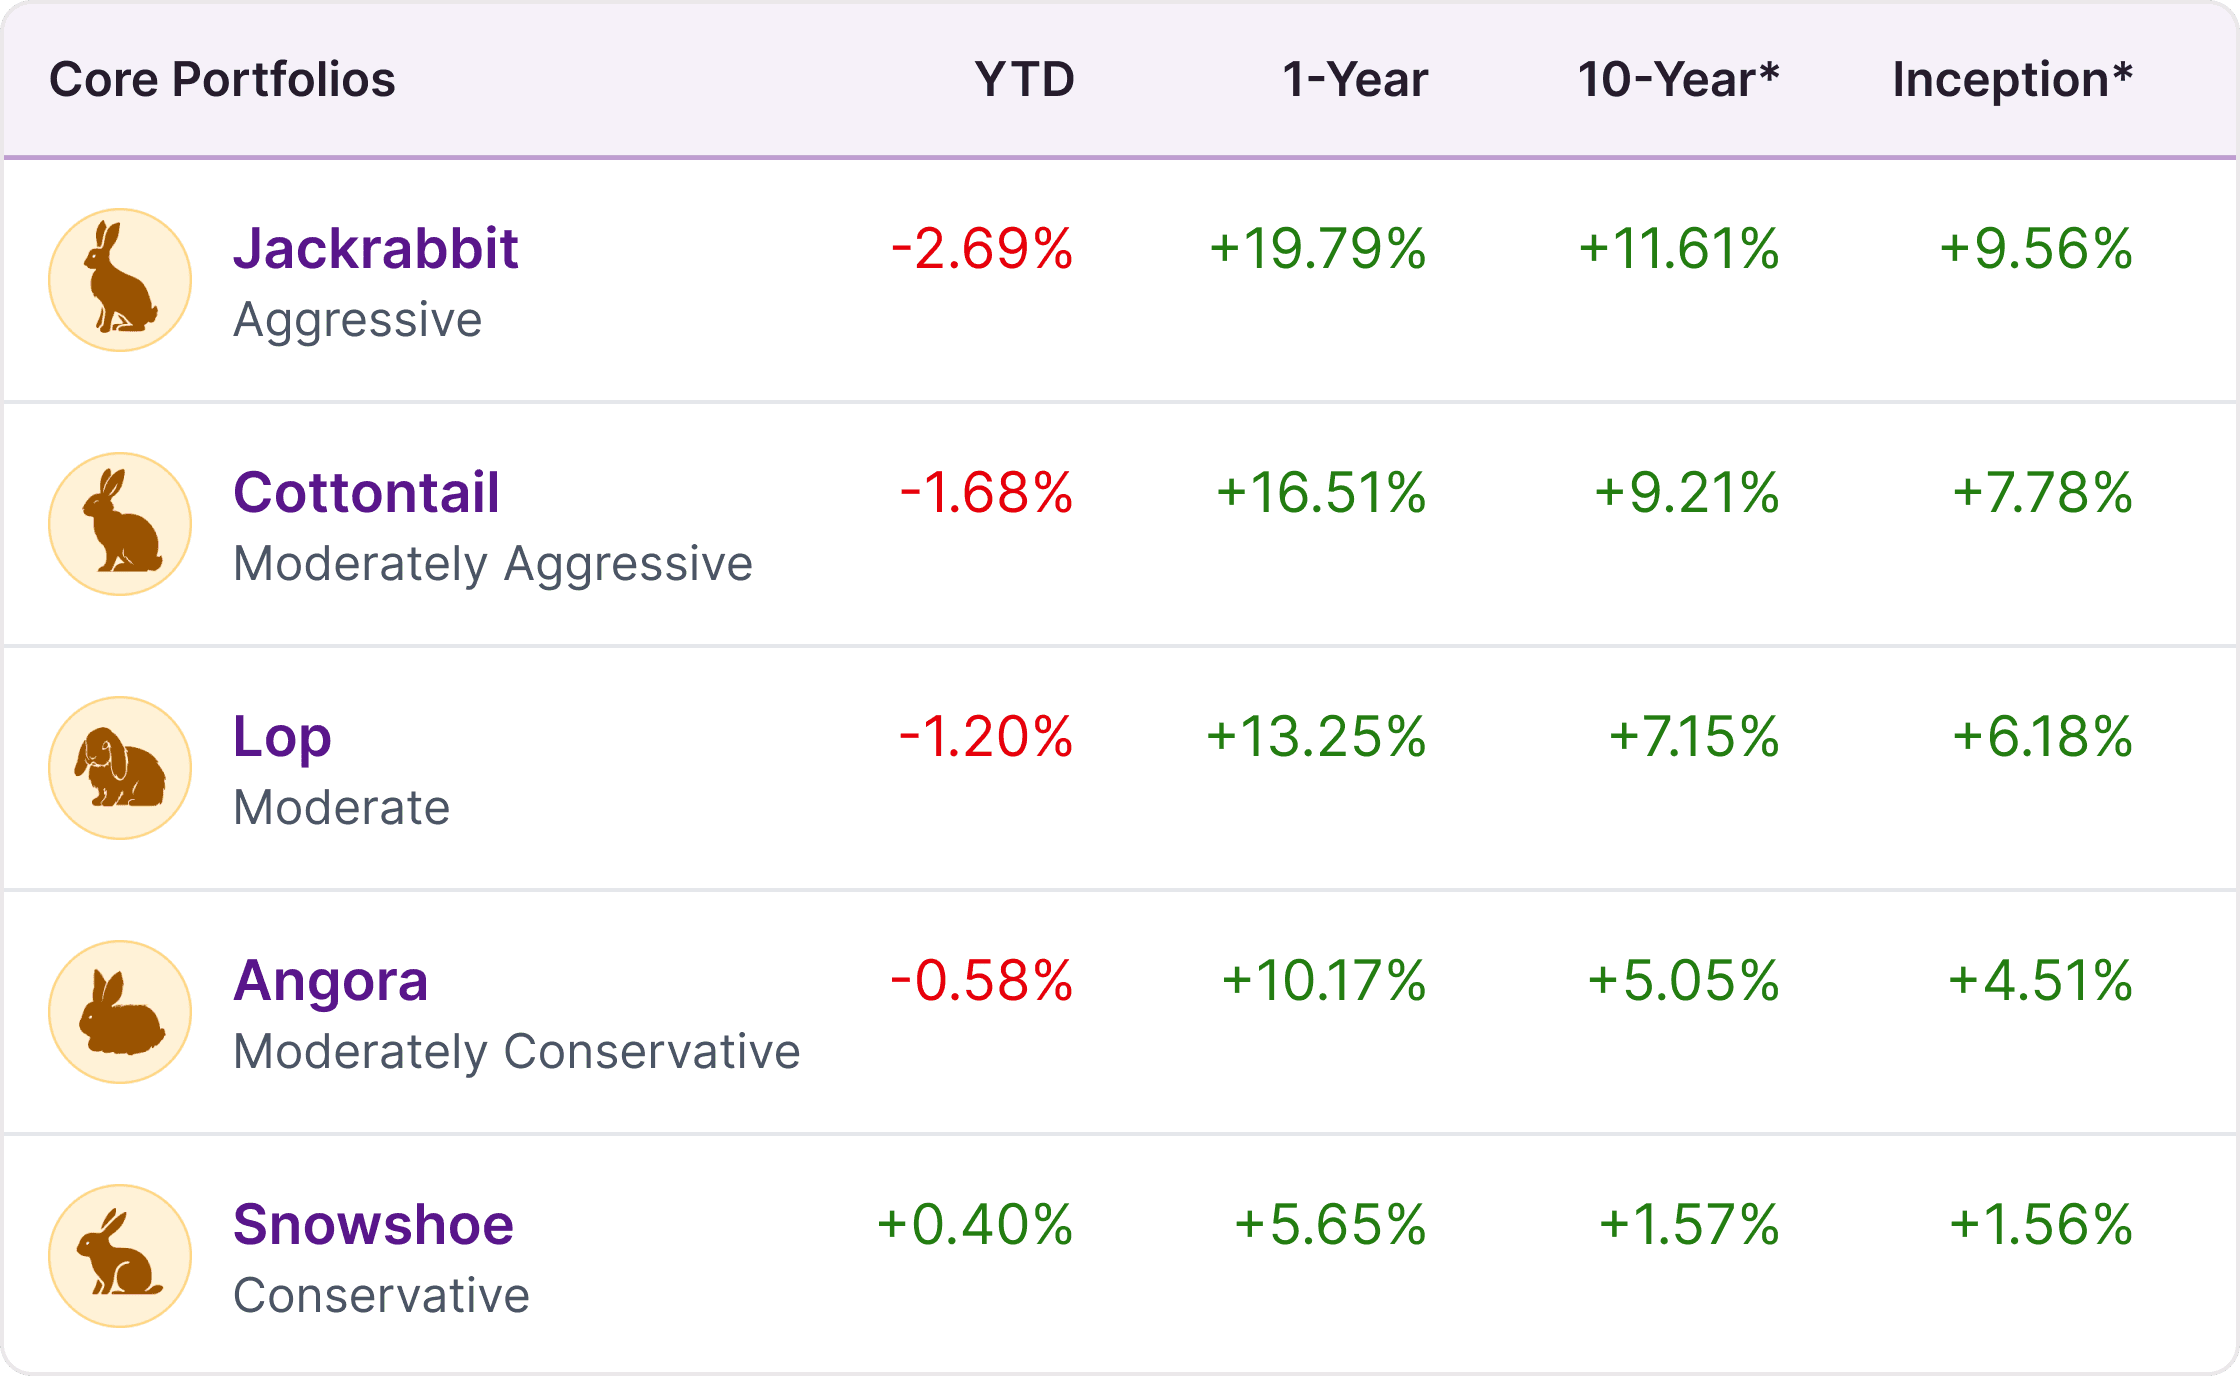
WealthRabbit runs five core portfolios, each built for a different risk tolerance. The S&P 500 finished Q1 down 4.63% year-to-date. Every WealthRabbit portfolio outperformed it.
*Annualized returns. Inception date: June 30, 2014. Performance shown is net of a 0.50% annual fee. Lower-tier fees of 0.20%–0.40% are available for qualifying accounts. Past performance does not guarantee future results.
Five portfolios. Five outperformers. “Snowshoe”, the most conservative of the group, was actually positive on the quarter, in a period where being flat would have been considered a win. And Jackrabbit, despite being built to take on equity risk, held up nearly 2 percentage points better than the S&P through one of its worst quarters in recent memory.
The 1-year numbers deserve their own moment. Jackrabbit is up almost 20% over the past 12 months. Cottontail is at 16.5%. Even Angora, which carries meaningful bond exposure, cleared 10%. These aren't numbers that happen by accident, they reflect a portfolio construction philosophy that holds up across market conditions, not just the good ones.
So what does Q2 look like?
Honestly? Nobody knows, and anyone telling you otherwise is selling something. What we do know is that the macro backdrop, sticky yields, trade policy uncertainty, election-year dynamics in several major economies, isn't going away cleanly. There will be more volatile months. The question isn't whether volatility happens. It's whether your portfolio is built to absorb it without requiring you to make a perfect decision at the worst possible moment.
That's exactly what the WealthRabbit portfolio design is built around. Not predicting the next move. Just making sure the next bad quarter doesn't become the reason your retirement plan changes.
Want to see the full allocation breakdown and historical returns for each portfolio? View all portfolios →
Disclaimer
This article is for informational purposes only and does not constitute financial or investment advice. All portfolio returns are net of a 0.50% annual advisory fee, reduced rates of 0.20%–0.40% may apply for qualifying accounts. Past performance is not a guarantee of future results. Market index data is included for illustrative comparison only and cannot be invested in directly. All investing carries risk, including the possible loss of principal. For advice tailored to your situation, please speak with a licensed financial advisor.
Related Blog Posts
--No related posts available--